
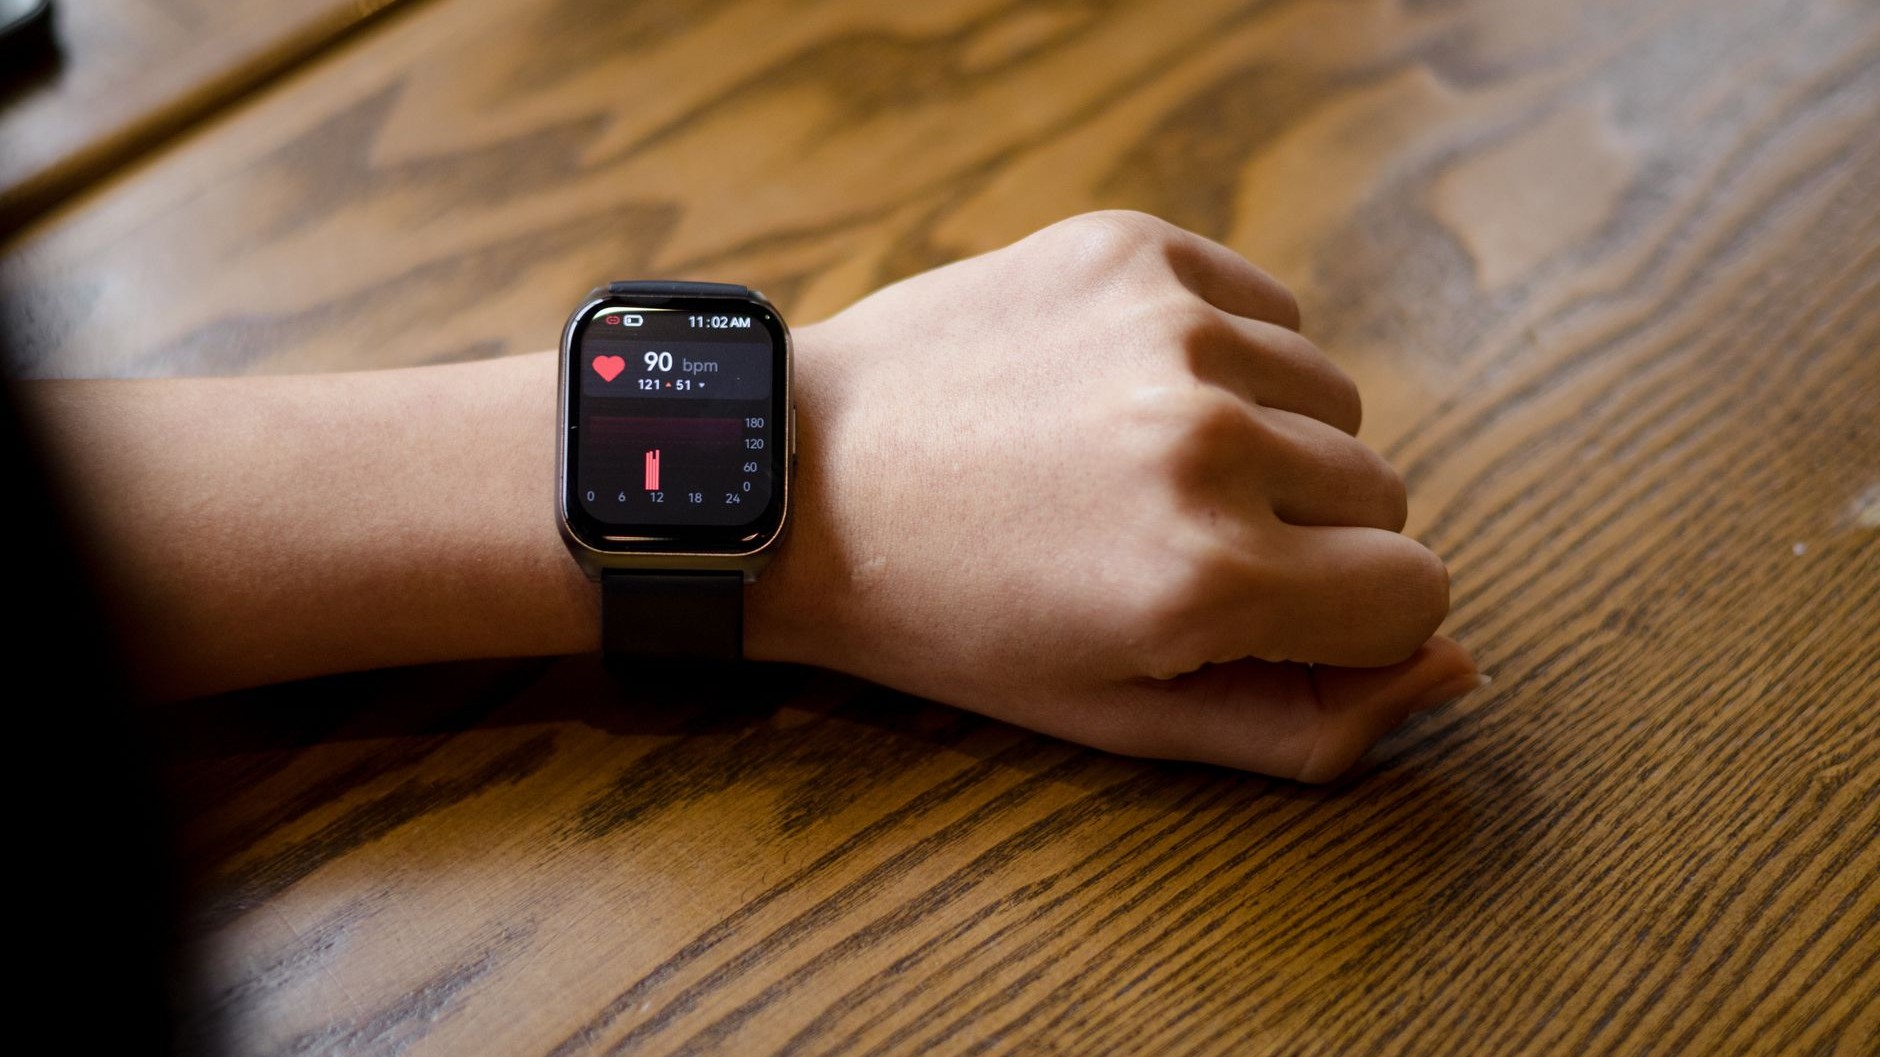
Eight hours in bed, night after night, yet waking up feeling like the mattress had personally conspired against you. That was the story for months, right up until a glance at the overnight heart-rate graph on a wrist-worn tracker told a very different tale: a jagged, restless line that never settled into the smooth dip it was supposed to make. The mattress was innocent all along. The real culprit was hiding in plain sight, beating away at 70-something bpm at 3am when it should have been resting closer to 50.
Key takeaways
- A wrist tracker’s overnight heart-rate graph exposed months of mislabeled blame
- The ‘hammock curve’ pattern shows when your body truly rests—and what breaks it
- One common evening habit was spiking heart rate at 3am without disrupting sleep duration
What a healthy overnight heart rate actually looks like
Sleep specialists describe the ideal pattern as a “hammock curve”: heart rate falls steadily as you drift into the earlier sleep stages, bottoms out around the midpoint of the night, then climbs gently again as morning approaches. The hammock curve shows an optimal overnight heart rate journey, with the body relaxing as blood pressure and heart rate begin to drop during initial sleep stages. The lowest resting heart rate typically occurs near the midpoint of sleep, when melatonin levels peak.
The numbers behind that dip are fairly consistent across the research. During deep sleep, blood pressure falls and heart rate slows to about 20% to 30% below your resting heart rate. A normal resting heart rate for most adults while sleeping ranges from 40 to 60 beats per minute, slower than the average daily resting rate of 60 to 100 bpm. Doctors even have a name for this nightly drop: when we’re healthy, blood pressure and heart rate naturally drop during sleep, a phenomenon called “nocturnal dipping,” which is a vital sign of the cardiovascular system’s ability to relax and recover.
Brief spikes aren’t automatically bad news, either. Your heart rate may momentarily rise during REM sleep, and this is normal, so you can ignore these temporary spikes when looking for the hammock curve. Dreaming about being chased, running for a bus, arguing with your boss? Your cardiovascular system responds as though it’s really happening. What matters isn’t the odd blip; it’s whether the graph keeps climbing back to a plateau and refuses to come back down.
The usual suspects behind a restless heart-rate line
Once I started comparing nights, a pattern emerged that had nothing to do with pillow firmness. The evenings I’d had a couple of glasses of wine, the line barely dipped below 65. This isn’t just anecdotal. A 2025 German study using continuous smartwatch monitoring on 40 healthy adults found that alcohol consumption led to a statistically significant increase in nocturnal resting heart rate from 63.6 bpm at baseline to 66.6 bpm during exposure, with rapid normalisation during the post-exposure phase. Interestingly, no significant changes were observed in objective sleep architecture, yet participants still reported reduced subjective sleep quality under alcohol exposure, suggesting a link to the elevated heart rate. In plain terms: you can technically get your eight hours and still feel wrecked, because your heart never gets the memo that it’s supposed to switch off.
Other laboratory work backs this up with a sharper edge. A separate polysomnography study found that during sleep, alcohol produced expected tachycardia and detriments in sleep quality including decreased total sleep time, sleep efficiency, and altered sleep architecture. And the effect isn’t limited to the first few hours after last call. Research presented at the Sleep meeting in 2024 found that alcohol elicited a steeper decline in nocturnal heart rate immediately after lights out, but a significant augmentation of heart rate during the later portion of the night, which may contribute to cardiovascular risk. So that 4am wake-up wasn’t randomness. It was your heart working the night shift.
Alcohol isn’t the only lever, of course. Looking at the resting heart rate curve in a tracker app can reveal the effects of late meals, evening workouts, alcohol, sickness, and being misaligned with your circadian rhythm. Stress sits high on that list too, largely because of how it interacts with the nervous system overnight: variability in heart rhythm comes from the sympathetic nervous system, which increases heart rate to deal with stress or high activity, and the parasympathetic nervous system, which slows the heart during rest, working together to keep the heart at an optimal rhythm. A stressful day, an unresolved argument, a looming deadline: all of it can keep the sympathetic side dialled up long after the lights go out, flattening the dip your graph is meant to show.
When it’s more than lifestyle
Occasionally the graph is pointing somewhere more clinical. Non-dipping, where heart rate falls less than 10% during sleep, and reverse dipping, where it actually rises, are both associated with increased cardiovascular risk, including stroke. One condition worth ruling out, particularly if snoring, gasping or daytime exhaustion feature alongside that restless line, is obstructive sleep apnoea. It’s far more common in the UK than most people assume: around 5% of people aged 30 to 70 in the UK, roughly 1.5 million people, have moderate or severe OSA, with an additional 20% having mild OSA, meaning an estimated 25% of the UK population, about 8 million people, have some degree of the condition. The frustrating part is how many go unrecognised. By 2019, diagnosed OSA in England stood at about 1.40% of adults, roughly 622,000 people, far below estimates suggesting the condition could affect around 4.8% of the population.
This matters for the heart-rate story because apnoea doesn’t just interrupt breathing; it hijacks the cardiovascular dip that’s supposed to happen overnight. Elevated or irregular heart rates can indicate stress, sleep apnea, or other medical conditions that may require attention. If your tracker consistently shows a flat or climbing line rather than a dip, alongside loud snoring or a partner mentioning breathing pauses, that’s a conversation for your GP, not another mattress topper.
Reading your own graph without becoming obsessive
Consumer trackers aren’t medical devices, and it’s worth holding that lightly. The numbers are best used to spot trends and guide habits, not as a diagnosis, since consumer devices estimate rather than directly measure sleep stages. What they’re genuinely good for is pattern-spotting over weeks, not panicking over a single rough night. Try skipping the second glass of wine for three or four nights and watch what happens to the shape of that curve. Notice whether the graph flattens on nights you ate a heavy meal at 9pm, or after a particularly tense day at work. That comparison against your own baseline, rather than some generic number pulled from an app, is where the real insight lives.
My mattress, as it turns out, was doing exactly what it was supposed to do the whole time. It was my evening habits, quietly logged in beats per minute, that were sabotaging the recovery eight hours of lying down was supposed to deliver. If your tracker’s graph looks similarly jagged, it’s worth mentioning to your GP, especially alongside snoring or daytime fatigue, since a night that never truly dips isn’t just a curiosity on a screen.
Sources : onlinelibrary.wiley.com | ncbi.nlm.nih.gov